Monitoring
Prometheus
Prometheus is a monitoring tool that gathers metrics in your infrastructure. You can integrate it by following the steps below.
Step 1: Navigate to your environment's configuration screen. You can do this by navigating to Environments in the menu on top, and selecting the environment which you'd like to configure with Prometheus by clicking on its card.
Step 2: In the menu bar on the left, navigate to Metrics. Prometheus settings should appear right away.
Step 3: Enable Prometheus with the toggle.
Prometheus settings
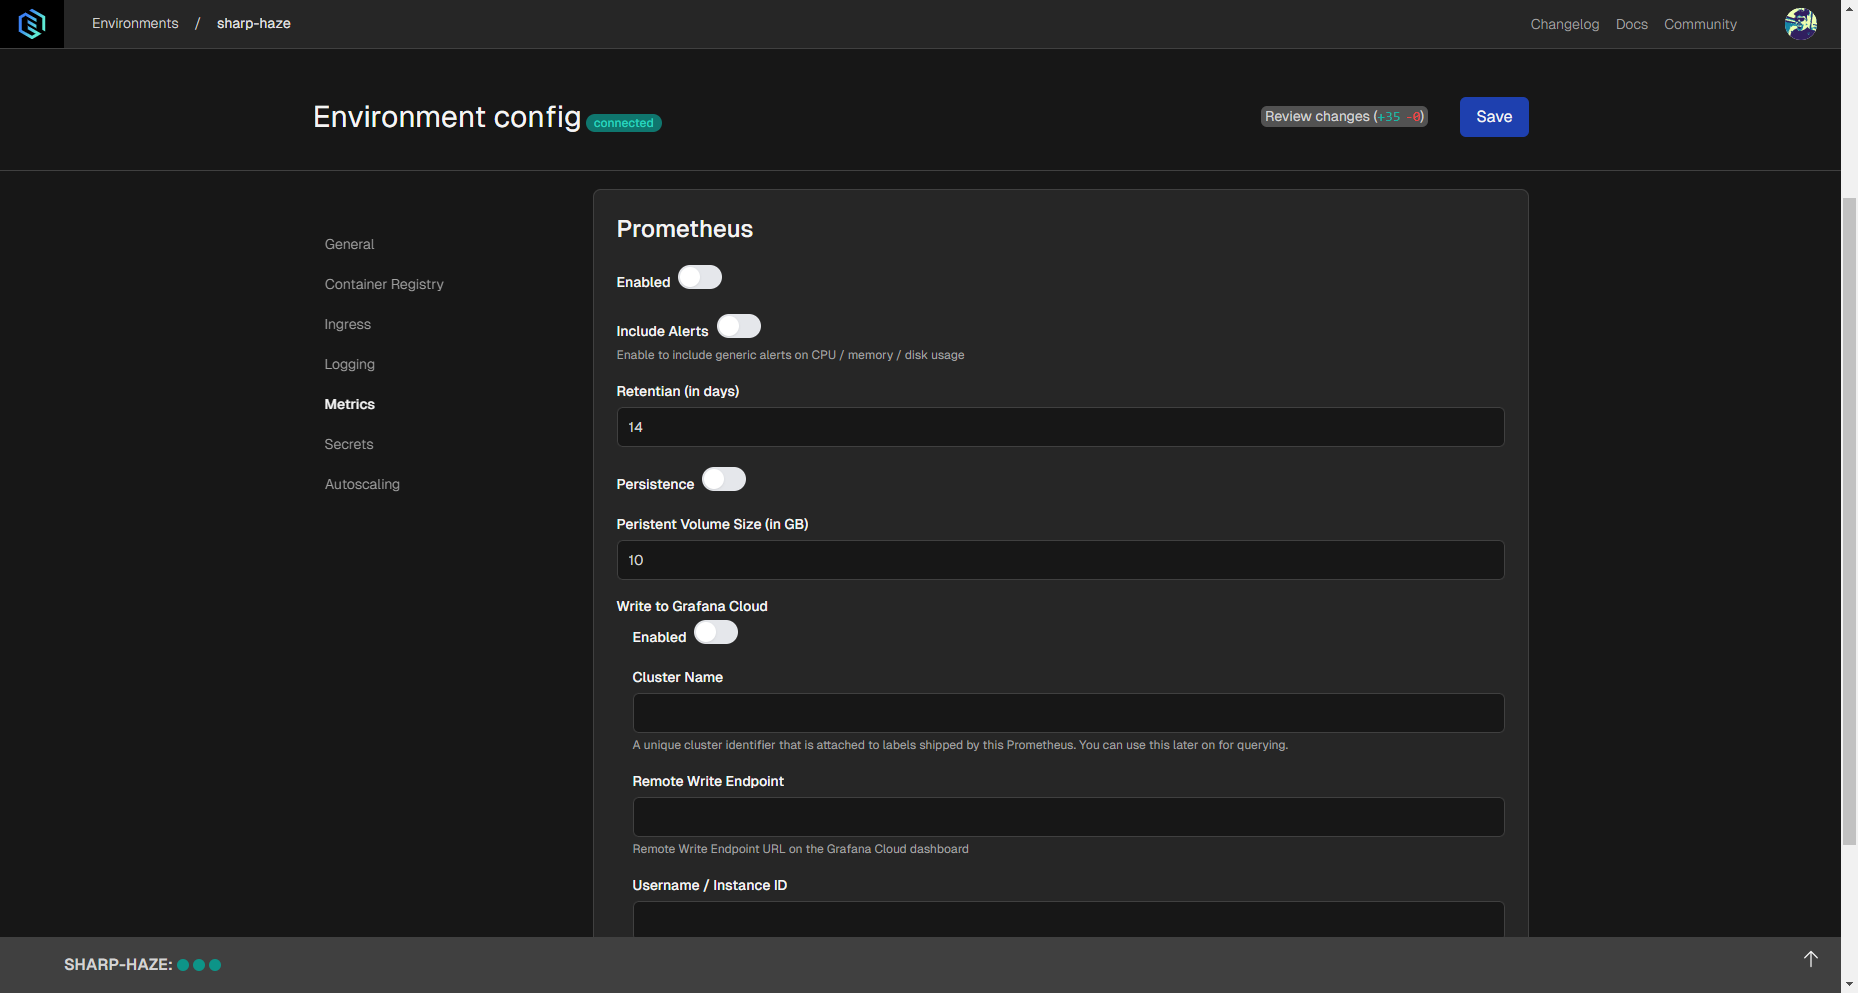
Include Alerts: Turn generic alerts about resource usage (CPU, memory, disk) on and off with this toggle.
Retention (in days): You can specify how many days you'd like to store Prometheus metrics for.
Persistence: Turn persistent metrics storage on and off with this toggle.
Persistent Volume Size (in GB): Persistent storage will be able to store the amount of data specified by you.
Write to Grafana Cloud: You can enable the configured Prometheus instance to write metrics to Grafana Cloud with this toggle. You need a Grafana Cloud account for this.
Cluster Name: Specify a unique cluster name which you can use later for querying.
Remote Write Endpoint: You can get this from your Grafana Cloud Portal, as described here.
Username / Instance ID: You can get the instance ID from your Grafana Cloud Portal, as described here.
Password / API Key: Your Grafana Cloud password.