Monitoring
Grafana
Grafana is the de-facto dashboarding solution in the cloud native space. It visualizes metrics collected by Prometheus. You can integrate Grafana by following the instructions described below.
Step 1: Navigate to your environment's config screen by clicking the Environments button on top, and selecting the environment by clicking on its card.
Step 2: In the menu on the left-side, navigate to Logging. Scroll down to find Grafana Cloud settings.
Step 3: Turn on the Enabled toggle.
Grafana Cloud Settings
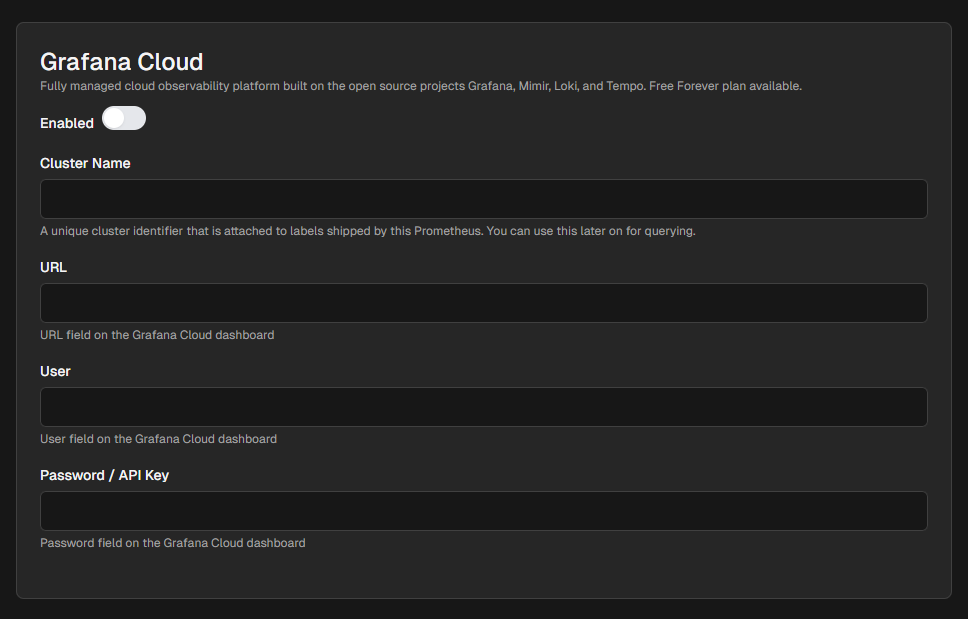
Cluster Name: Specify a unique cluster name which you can use later for querying.
URL: The URL of the Grafana Cloud dashboard you'd like to use with this environment.
User: Your Grafana Cloud username.
Password / API Key: Your Grafana Cloud password.